


Next Wave Marketing Report: Data Hub
Huntington Beach lodging performance, market intelligence and industry trends.
Lodging
Back to Top of ListHotel Performance: August 2026
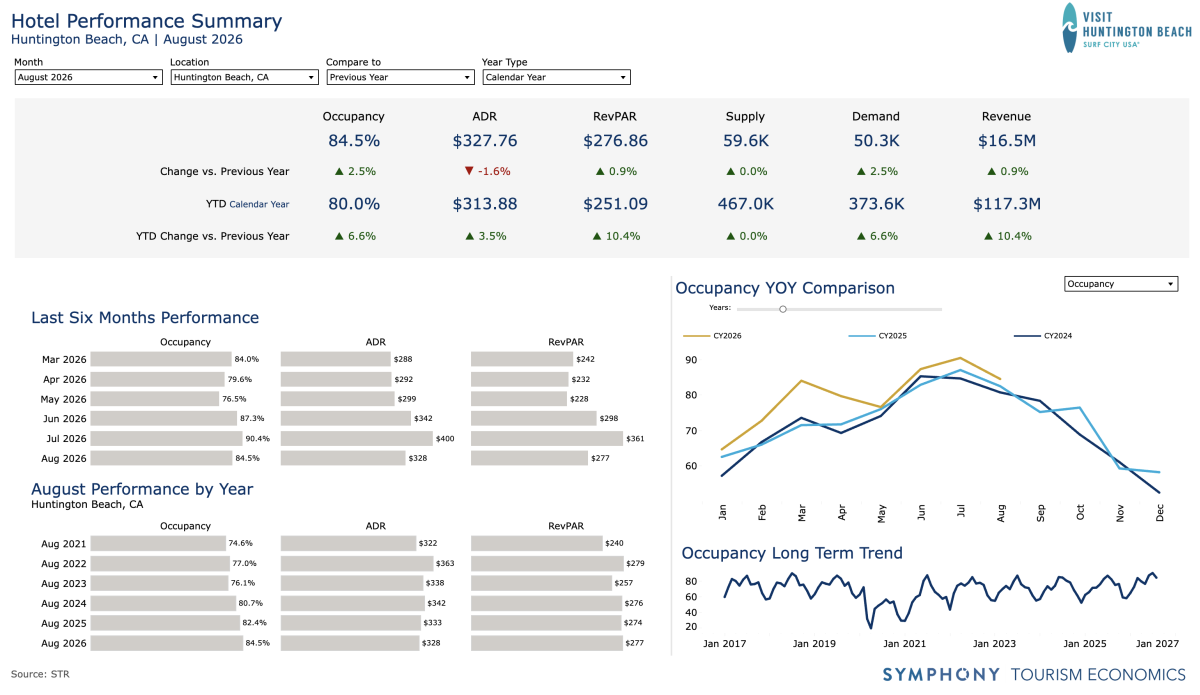
| 84.5% Occupancy | $327.76 ADR | $276.86 RevPAR | $16.5M Revenue |
| ▲2.5% YOY | ▼1.6% YOY | ▲0.9% YOY | ▲0.9% YOY |
Huntington Beach's lodging market posted strong August performance. Overall occupancy reached 84.5% (+2.5% YOY), while ADR dipped slightly at $328 (-1.6%) and RevPAR remained up 0.9% at $276.86. Despite flat available supply, lodging revenue held steady at $16.5 million.
- Occupancy
- August 2026: 84.5%
August 2026 occupancy reached 84.5%, outperforming August 2025 by 2.1% and demonstrating the strongest August performance in the post-pandemic era. - All-Time Record High: 90.4% (July 2026)
- All-Time Record Low: 19.4% (April 2020)
- August 2026: 84.5%
- Average Daily Rate (ADR)
- August 2026: $327.76
- All-Time Record High: $402.83 (July 2022)
- All-Time Record Low: $117.54 (April 2020)
- RevPAR
- August 2026: $276.86
August RevPAR amounted to $276.86, keeping steady with August 2025 and August 2024 at $274 and $276, respectively. - All-Time Record High: $361 (July 2026)
- All-Time Record Low: $23 (April 2020)
- August 2026: $276.86
Hotel Performance: Competitive Markets
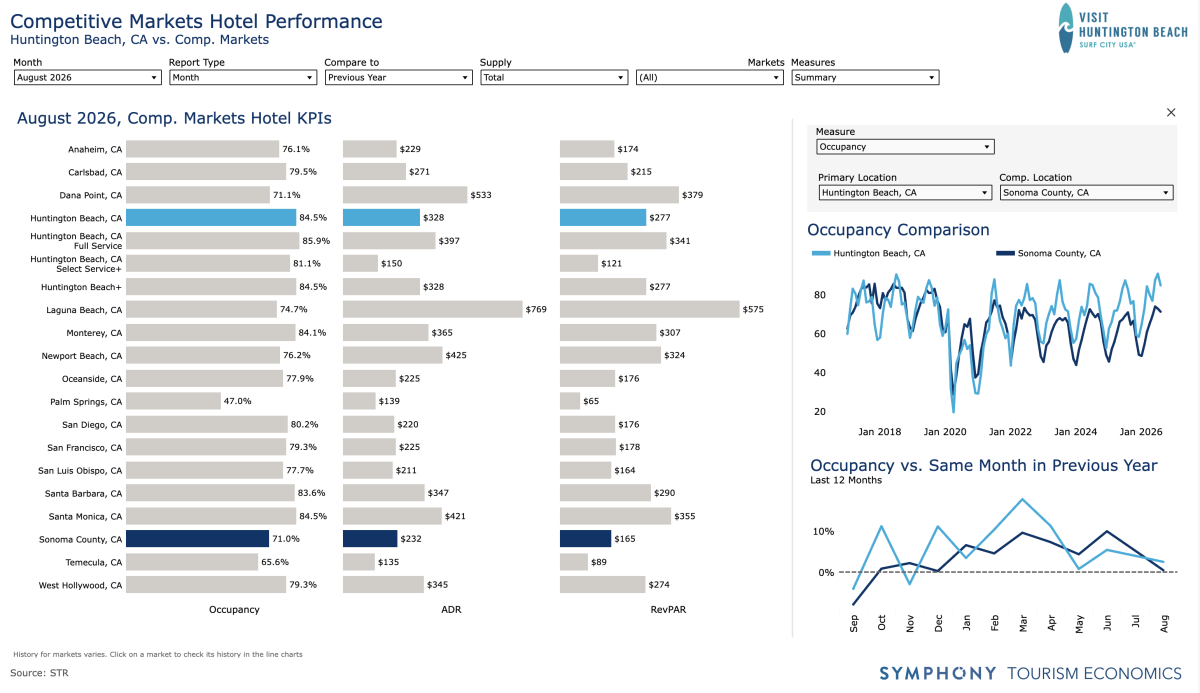 Comparing the August 2026 performance of six competitive non-Orange County beachside destinations (Carlsbad, Monterey, Oceanside, Santa Barbara, Santa Monica, San Luis Obispo), Huntington Beach was tied with Santa Monica for first in Occupancy, third in ADR, and third in RevPAR.
Compared to three competitive Orange County beachside destinations (Dana Point, Laguna Beach, Newport Beach), Huntington Beach was first in Occupancy, and fourth in ADR and RevPAR.
Economic Outlook
Back to Top of ListU.S. Travel Recovery Tracker Report
Rising gas prices, inflation, and renewed tariff concerns contributed to declining consumer sentiment in August, particularly among lower- and middle-income households. Despite these pressures, consumer spending remained resilient, with stronger-than-expected retail sales and continued growth in food services, electronics, and recreation.
Household financial wealth reached a record 280% of annual income, although gains were concentrated among the top 20% of earners. This growing wealth divide has allowed higher-income households to maintain spending, while lower- and middle-income consumers face depleted savings, rising loan delinquencies, and higher living costs.
Higher borrowing costs and slowing wage growth are placing additional pressure on household budgets. Travel-related inflation remains elevated, with motor fuel (+27.9%), transportation (+25.6%), and airfare (+23.4%) experiencing the largest year-over-year price increases. Lodging prices rose 2.9%, while the overall Travel Price Index increased 7.4% compared to a 3.4% increase in the Consumer Price Index.
Marketing
Back to Top of ListWebsite Performance Overview
| Engagement Rate | Events Per Session |
|---|---|
| 68.8% | 10.9 |
| ▼0.15% YOY | ▲14.55% YOY |
Website engagement held steady at 68.8%, remaining nearly unchanged from September 2025. Events per session increased 14.55% YOY. This reflects an increase in average number of website interactions per visitor, suggesting almost 15% more active engagement with destination content.
Top Website Markets
| Cities | Countries |
| Los Angeles | United States |
| Anaheim | Singapore |
| San Diego | Canada |
| Las Vegas Valley | United Kingdom |
| Santa Ana | Australia |
| Long Beach | Sweden |
| Irvine | Germany |
| Phoenix | India |
| San Francisco | Japan |
| Costa Mesa | Mexico |
Travel Trends
Back to Top of ListThe State of the American Traveler: September 2026
Traveler Confidence & Spending
- 46.6% of travelers anticipate a recession within the next six months, reflecting continued economic uncertainty.
- Average annual leisure travel budgets reached $5,697, up from $5,340 the previous month but below $6,184 a year ago.
- 36.4% cite overall travel costs as a barrier, highlighting continued concerns around affordability.
Takeaway: Economic uncertainty continues to influence travel spending, although leisure travel remains a priority for many Americans.
Travel Activity & Intent
- 57.5% took an overnight leisure trip in the past month, up from 50.8% a year ago.
- 25.2% frequently take last-minute leisure trips, up from 17.6% year over year and the highest level recorded in the study.
- 43.6% of Gen Z travelers frequently take spontaneous trips, compared to 36.8% of higher-income travelers.
Takeaway: Leisure travel remains resilient, with growing interest in spontaneous trips creating opportunities for destinations to capture last-minute bookings.
AI & Travel Planning
- 31.9% used AI tools for travel planning in the past year, up from 22.6% year over year.
- Gen Z and Millennials lead AI adoption, demonstrating the growing influence of emerging technology on travel research.
- 65% prefer receiving local travel advice from a person rather than an AI tool.
Takeaway: AI is becoming an increasingly important travel planning resource, but personalized recommendations and human expertise remain valuable.
Social Media Influence
- YouTube leads social media travel research at 35.9%, followed by Facebook (33.8%), Instagram (27.3%), and TikTok (20.6%).
- Social platforms continue to influence destination discovery and trip planning, particularly among younger travelers.
Takeaway: Social media remains an important channel for reaching potential visitors, reinforcing the value of engaging destination content across multiple platforms.
Travel Affordability & Barriers
- 31% identify gas prices as a travel barrier, nearly double the 16.8% reported a year ago.
- 36.4% cite overall travel costs as a barrier to travel.
- Financial pressures are particularly pronounced among lower-income households.
Takeaway: Rising travel costs continue to shape consumer decisions, emphasizing the importance of communicating value and affordability to potential visitors.
Industry Reports
Back to Top of ListLodging Reports
Economic Reports
Travel Trends & Insight
Lodging
Hotel Performance: July 2026
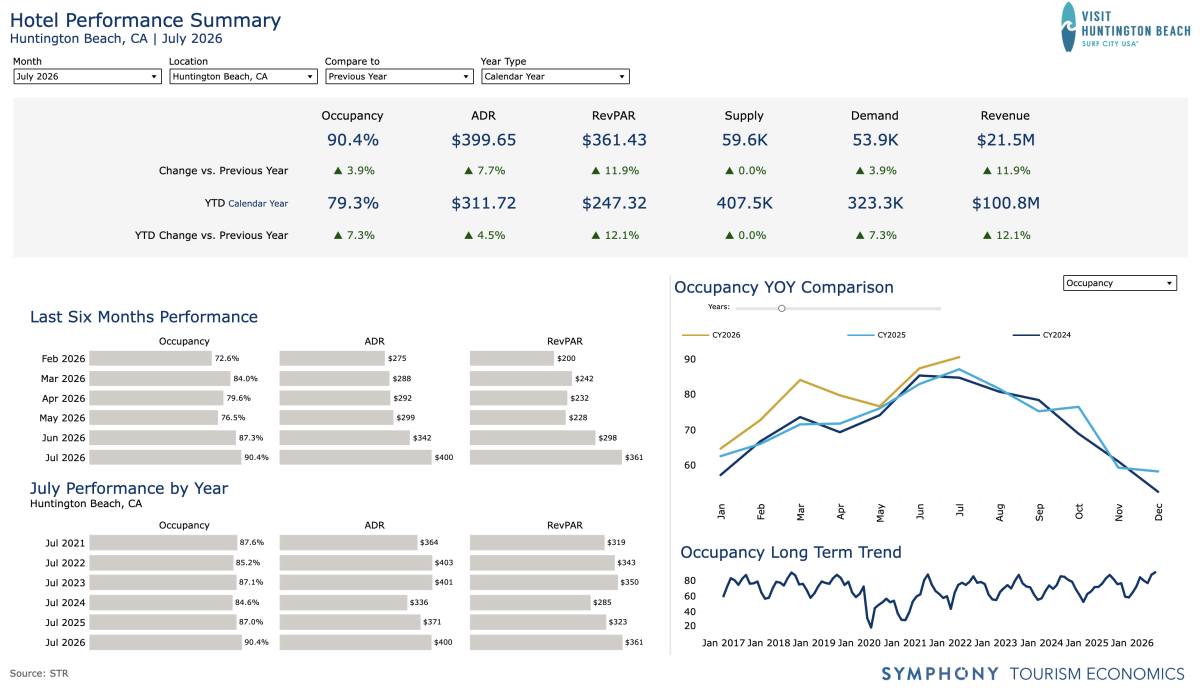
| 90.4% Occupancy | $400 ADR | $361 RevPAR | $21.5M Revenue |
| ▲3.9% YOY | ▲7.7% YOY | ▲11.9% YOY | ▲11.9% YOY |
Huntington Beach's lodging market showed solid growth in July 2026, driven by higher occupancy and continued ADR gains. Overall occupancy increased 3.9% YOY to 90.4%, while ADR rose 7.7% to $400, helping RevPAR grow 11.9% YOY to $361. Demand increased 3.9% YOY despite flat available supply, supporting an increase in total lodging revenue to $21.5 million.
- Occupancy
- July 2026: 90.4%
July occupancy reached 90.4%, outperforming June by 3.6% and demonstrating the strongest July performance in the post-pandemic era. - NEW All-Time Record High: 90.4% (July 2026)
- Previous All-Time Record High: 90.1% (July 2018)
- All-Time Record Low: 19.4% (April 2020)
- July 2026: 90.4%
- Average Daily Rate (ADR)
- July 2026: $400
July ADR reached $399.65, up 7.7% year-over-year, while occupancy increased 3.9%, resulting in stronger overall hotel revenue performance compared to prior years. - All-Time Record High: $402.83 (July 2022)
- All-Time Record Low: $117.54 (April 2020)
- July 2026: $400
- RevPAR
- July 2026: $361
July RevPAR amounted to $361, outperforming last year by over 11% while remaining 26.7% above 2024 levels. - NEW All-Time Record High: $361 (July 2026)
- Previous All-Time Record High: $349 (July 2023)
- All-Time Record Low: $23 (April 2020)
- July 2026: $361
Hotel Performance: Competitive Markets
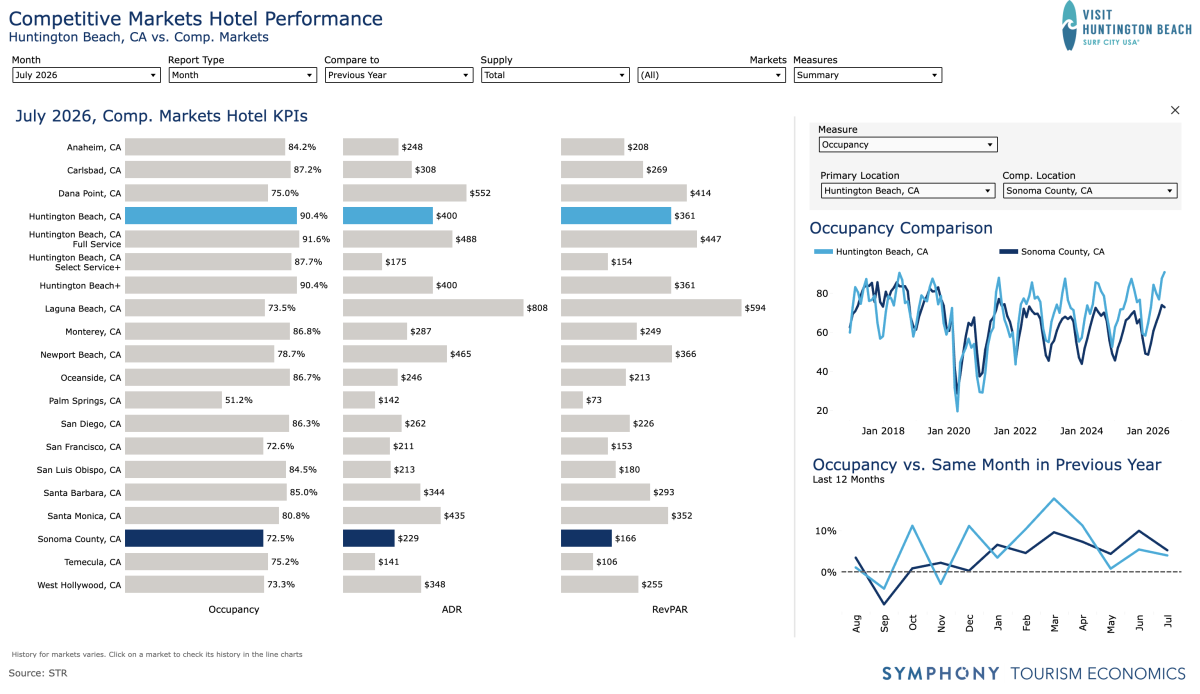 Comparing the July 2026 performance of six competitive non-Orange County beachside destinations (Carlsbad, Monterey, Oceanside, Santa Barbara, Santa Monica, San Luis Obispo), Huntington Beach was first in Occupancy, and second in ADR, and first in RevPAR.
Compared to three competitive Orange County beachside destinations (Dana Point, Laguna Beach, Newport Beach), Huntington Beach was first in Occupancy, and fourth in ADR and RevPAR.
Monthly Hotel Performance Forecast
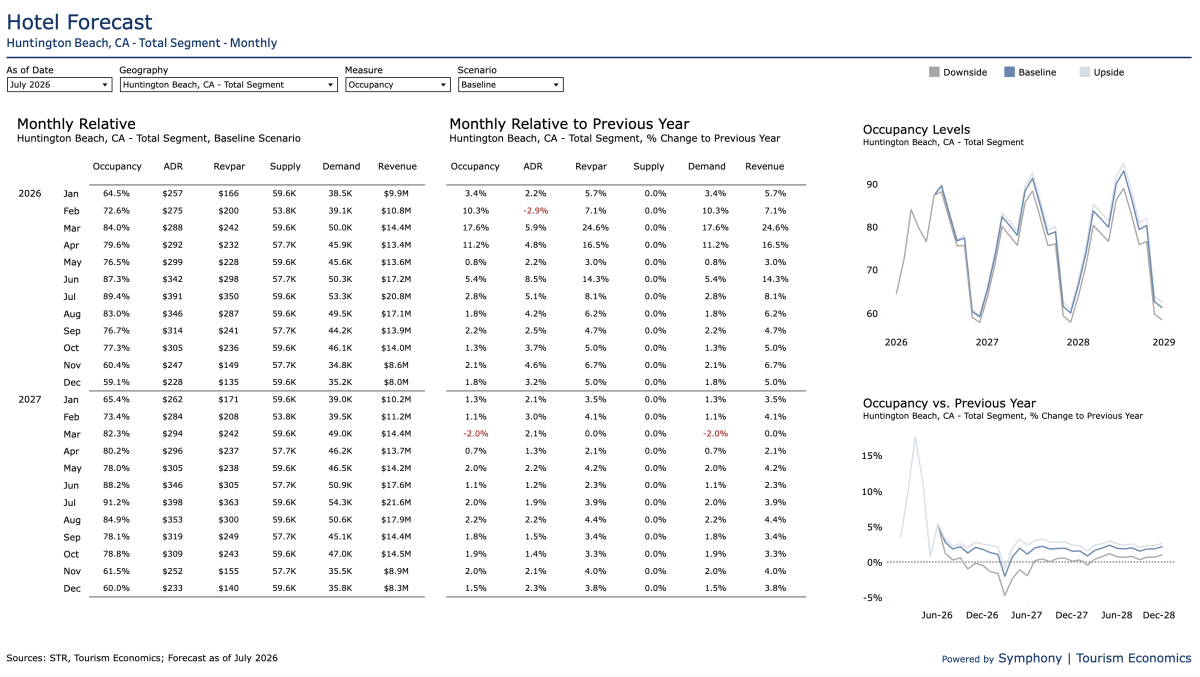
Huntington Beach hotel performance is forecast to maintain positive year-over-year growth through the remainder of 2026. Occupancy is projected to stay above 2025 levels each month, while continued ADR growth is expected to support stronger RevPAR and overall hotel revenue.
- September: Occupancy is projected at 76.7%, up 2.2% YOY, while RevPAR and revenue are both forecast to grow 4.7%.
- October: Occupancy is forecast at 77.3%, with ADR up 3.7% and revenue up 5.0% YOY.
- November and December: Occupancy growth is expected to remain modest, while ADR gains help drive projected revenue increases of 6.7% and 5.0%, respectively.
Economic Outlook
U.S. Travel Recovery Tracker Report
Economic conditions remained mixed in July, with easing inflation and continued consumer spending providing some stability while elevated prices and weaker consumer sentiment continue to create pressure. Inflation slowed slightly to 3.4%, but household purchasing power remains challenged, particularly among lower-income consumers.
Travel-related spending continues to show strength. Spending on food and beverage, air travel, lodging and recreation increased 6.7% year over year in July, outpacing overall consumer spending growth of 4.4%. Services spending also remained strong, increasing 6.3%.
Travel costs, however, continue to rise faster than overall consumer prices. The Travel Price Index increased 7.1% year over year in July, compared with a 3.3% increase in the Consumer Price Index. Transportation and airfare have been particularly affected by higher fuel costs, while lodging prices increased a more modest 2.6% year over year.
Consumer sentiment also remains subdued. The Consumer Confidence Index stood at 90.8, while Consumer Sentiment measured 51.0, reflecting continued uncertainty even as household wealth and a relatively stable labor market provide support for spending. Looking ahead, consumer spending is expected to grow at a 1.7% annualized rate in Q3.
What this means for travel: Consumers are continuing to spend on travel and recreation despite concerns about prices and the broader economy. However, higher travel costs and differences in purchasing power across income groups could make value, affordability and perceived value for money increasingly important considerations for travelers.
Marketing
Website Performance Overview
| Engagement Rate | Events Per Session |
|---|---|
| 68.7% | 10.9 |
| ▲5.48% YOY | ▲15.37% YOY |
Website engagement shows positive year-over-year growth. Engagement rate - the percentage of sessions in which visitors actively engaged with the site - increased 5.48% YOY. Events per session, which measures the average number of interactions visitors completed during each session, increased 15.37% YOY, indicating more frequent interaction with content across SurfCityUSA.com.
Top Website Markets
| Cities | Countries |
| Los Angeles | United States |
| Anaheim | Canada |
| San Diego | China |
| Las Vegas Valley | Singapore |
| Santa Ana | United Kingdom |
| Long Beach | Australia |
| Phoenix | Germany |
| Irvine | India |
| San Jose | Japan |
| Seattle | Mexico |
Travel Trends
The State of the American Traveler: July 2026
Traveler Confidence
- 34.0% of travelers said their household was financially better off than a year ago, down slightly from 35.6% the prior month.
- Recession expectations continued to improve, falling to 43.8% from 45.0%.
- 50.6% said they are being careful with their money because of recession concerns.
Takeaway: Financial confidence softened following last month’s rebound, although recession expectations continued to ease.
Travel Spending
- 34.3% said now is a good time to spend on leisure travel, down from 37.7%.
- Average annual leisure travel budgets declined to $5,340, compared with $6,022 the prior month.
- 56.9% still consider leisure travel a high spending priority over the next three months.
Takeaway: Travelers are showing greater caution around discretionary spending, but leisure travel continues to hold a meaningful place in household budgets.
Travel Activity & Intent
- 56.2% took an overnight leisure trip in the past month, holding steady and remaining above the 54.1% reported a year ago.
- 24.6% now begin planning a week-long domestic trip just 1 - 4 weeks before departure, continuing a shift toward shorter planning windows.
- Preference for road trips climbed to 35.1%, while preference for air travel declined to 39.0%.
Takeaway: Travel activity remains resilient, but travelers are increasingly making decisions closer to departure and showing greater preference for road trips.
Cost Pressures
- 36.1% cited the cost of travel as a barrier, compared with 30.4% a year ago.
- 32.0% cited expensive gas as a deterrent, nearly double the 17.0% reported a year ago.
- Airfare was cited as a barrier by 27.3% of travelers, up from 23.3% a year ago.
Takeaway: Cost remains the most significant barrier to travel, reinforcing the importance of value as travelers make increasingly price-conscious decisions.
Industry Reports
Lodging Reports
Economic Reports
- U.S. Travel Recovery Tracker Report: July 2026
- Economic Forecast: June 2026
- Air Passenger Report: July 2026
Travel Trends & Insight
Lodging
Hotel Performance: June 2026
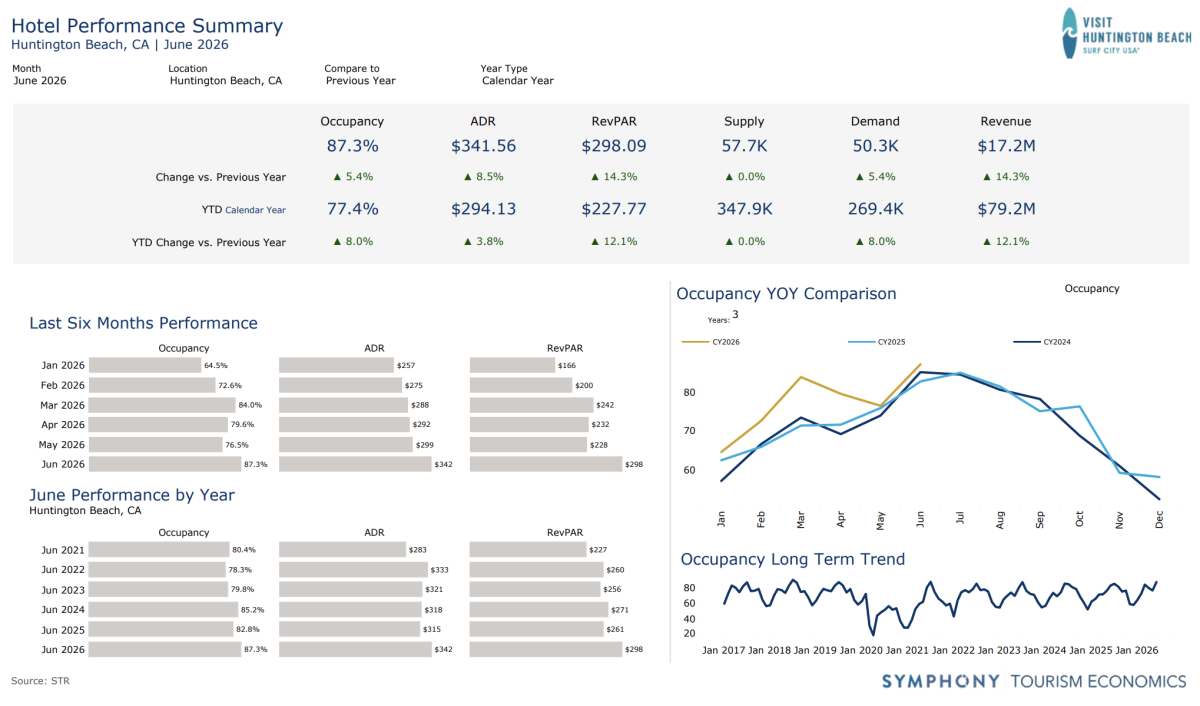
| 87.3% Occupancy | $342 ADR | $298 RevPAR | $17.2M Revenue |
| ▲5.4% YOY | ▲8.5% YOY | ▲14.3% YOY | ▲14.3% YOY |
Huntington Beach's lodging market showed solid growth in June 2026, driven by higher occupancy and continued ADR gains. Overall occupancy increased 5.4% YOY to 87.3%, while ADR rose 8.5% to $342, helping RevPAR grow 14.3% YOY to $298. Demand increased 5.4% YOY despite flat available supply, supporting an increase in total lodging revenue to $17.2 million.
- Occupancy
- June 2026: 87.3%
June occupancy reached 87.3%, outperforming May by 10.8% and demonstrating the strongest June performance in the post-pandemic era. - All-Time Record High: 90.1% (July 2018)
- All-Time Record Low: 19.4% (April 2020)
- June 2026: 87.3%
- Average Daily Rate (ADR)
- June 2026: $342
June ADR reached $342, up 8.5% year-over-year, while occupancy increased 5.4%, resulting in stronger overall hotel revenue performance compared to prior years. - All-Time Record High: $402.83 (July 2022)
- All-Time Record Low: $117.54 (April 2020)
- June 2026: $342
- RevPAR
- June 2026: $298
June RevPAR amounted to $298, outperforming last year by over 14% while remaining 41% above 2024 levels. - All-Time Record High: $349 (July 2023)
- All-Time Record Low: $23 (April 2020)
- June 2026: $298
Hotel Performance: Competitive Markets
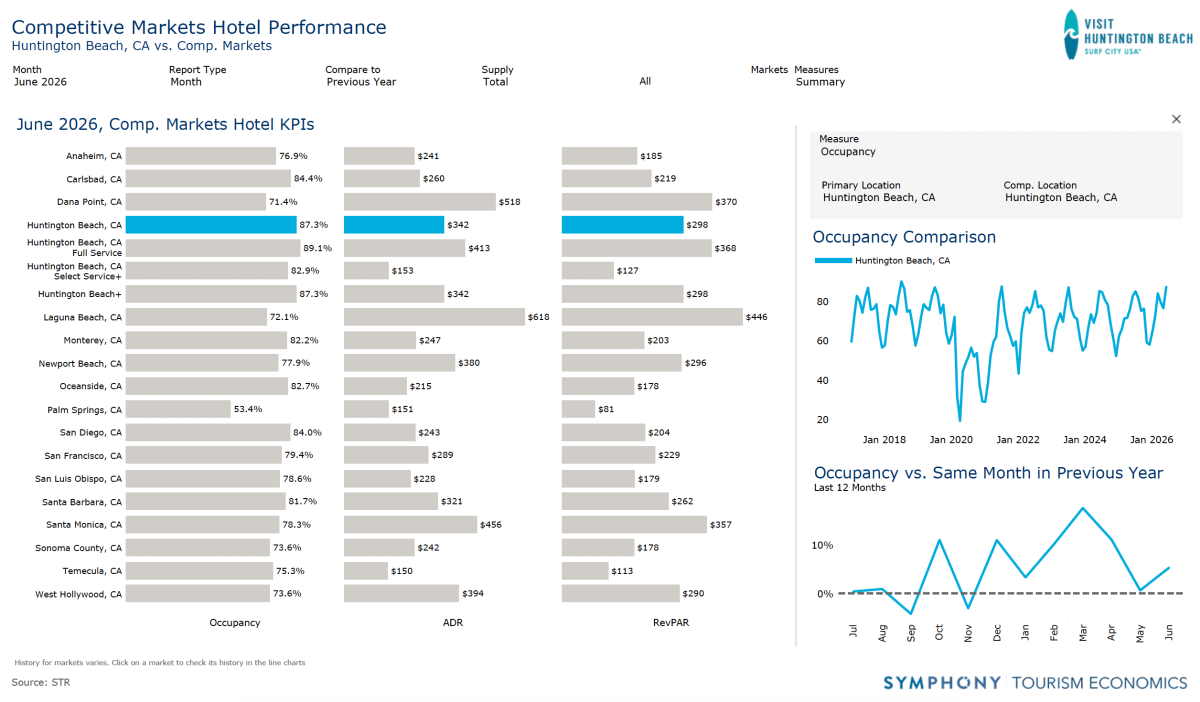 Comparing the June 2026 performance of six competitive non-Orange County beachside destinations (Carlsbad, Monterey, Oceanside, Santa Barbara, Santa Monica, San Luis Obispo), Huntington Beach was first in Occupancy, and second in ADR and RevPAR.
Compared to three competitive Orange County beachside destinations (Dana Point, Laguna Beach, Newport Beach), Huntington Beach was first in Occupancy, and fourth in ADR and RevPAR.
Biannual Hotel Performance Forecast
Economic Outlook
U.S. Travel Recovery Tracker Report
- The Consumer Price Index (CPI) fell 0.4% month-over-month in June, driven by a sharp drop in gasoline prices, pulling year-over-year inflation down from 4.2% to 3.5%.
- Thanks to the slower rate of inflation, growth in real average hourly earnings is set to turn positive for the first time since February.
- Risks remain as oil prices have risen following renewed hostilities between the US and Iran.
- There are indications that the AI-driven shortage of memory chips is starting to push up the costs of smartphones, computers, and related products.
- Overall, economic outlook remains solid.
- Should Middle East tensions continue to subside, falling oil prices will reduce the drag on real incomes over the second half of the year, helping maintain consumer spending growth.
- Core inflation is still expected to remain above the Federal Reserve's 2% target longer than previously projected because AI-related demand will keep electronics inflation elevated.
Marketing
Website Performance Overview
| Total Sessions | Organic Search Sessions | Paid Search Sessions |
| 86.3K | 48.9K | 21.4K |
| ▼37.1% YOY | ▼48.8% YOY | ▲58.4% YOY |
Website traffic declined year-over-year, driven primarily by lower organic search traffic, while paid search sessions increased 58.3%, partially offsetting the decline. The decrease in organic traffic is consistent with broader shifts occurring across the industry. Destination organizations are navigating changes in how travelers discover and consume information online, including increasingly fragmented search journeys and AI-assisted discovery.
Top Website Markets
| Cities | Countries |
| Los Angeles | United States |
| Anaheim | China |
| San Diego | Singapore |
| Las Vegas Valley | Canada |
| Santa Ana | United Kingdom |
| Long Beach | Germany |
| Irvine | Mexico |
| Phoenix | India |
| San Jose | Australia |
| Costa Mesa | Japan |
Travel Trends
The State of the American Traveler: July 2026
Traveler Confidence
- 35.6% of travelers said their household was financially better off than a year ago, up 6.4 percentage points from June.
- Recession expectations fell to 45%, down from 51% the prior month.
Takeaway: Consumer confidence improved meaningfully after weakening the previous month.
Travel Spending
- Average maximum annual leisure travel budgets increased nearly $900 to $6,022.
- 37.7% said now is a good time to spend on leisure travel, up from 31.6%.
- 61.2% continued to consider leisure travel a high spending priority.
Takeaway: Improving financial sentiment appears to be translating into greater willingness to allocate money towards travel.
Travel Activity & Intent
- 56.2% took an overnight leisure trip in the past month, compared with 52.7% the prior month and 51.1% a year earlier.
- Travel intentions strengthened for August and September.
- 55.9% planned to take at least one road trip during the summer.
Takeaway: Actual travel activity and near-term intent remain healthy heading into the latter part of summer.
Cost Pressures
- 36.6% cited travel costs as a barrier.
- 31.5% said gas prices would deter them from traveling.
- Despite those pressures, more than half still planned summer road trips.
Takeaway: Costs remain a meaningful constraint, but appear to be affecting how consumers travel rather than eliminating travel altogether.
Industry Reports
Lodging Reports
Economic Reports
- U.S. Travel Recovery Tracker Report: June 2026
- Economic Forecast: June 2026
- Air Passenger Report: June 2026